XTester
Strategy parameter robustness: how to test nearby settings
You have selected a strategy configuration, and its backtest looks acceptable. The next question is how much that result depends on an exact period or threshold. Move the setting slightly: does the strategy behave similarly, or do most of its trades disappear?
A parameter robustness check addresses that narrow question. Choose nearby values in advance, keep the test conditions fixed and examine the whole set of results. Simply taking the most profitable row afterwards turns the exercise into another round of optimization.
Define nearby parameters before running the tests
Start with a specific candidate: a saved code version and its complete configuration. Record how you selected it and how many alternatives were considered. A local check does not erase that earlier search.
Choose a parameter whose meaning you can explain. An indicator period is an integer number of bars; a price threshold has its own units and valid increments. Switching the type of signal changes the logic itself, so treat it as a separate hypothesis rather than a nearby numerical value. There is no universal percentage adjustment that suits every parameter.
An example test plan, not a backtest result. Suppose a teaching strategy uses a moving-average period of 20 bars. Before inspecting any results, list 18, 19, 20, 21 and 22 as the values to check. Keep every other parameter unchanged. This illustrates how to define a local neighborhood; it does not recommend a moving-average period or range for live trading. No trades, returns or XTester run have been calculated for this example.
Changing one parameter at a time makes differences easier to trace. If settings interact, follow with combinations listed in advance. An entry period and an exit threshold, for example, may each look unremarkable on their own while jointly changing how long positions remain open. One-at-a-time checks do not cover those interactions. Exclude invalid combinations using the strategy's rules before calculation, not because their returns look poor.
Record the decision rule too: which changes need investigation, which drawdown is unacceptable and what would leave you with insufficient evidence. Thresholds should come from the research objective and risk constraints, not be adjusted to fit the table. There is no universal minimum trade count: dependence between trades, holding periods and the range of market conditions also matter.
What to keep fixed across backtests
Neighboring configurations should use the same source and saved history, instrument, timeframe, trading window, starting funds, initial positions and orders, position sizing, fees and execution model. Only the declared parameter changes. If calculation involves randomness, specify the generation procedure and seeds in advance.
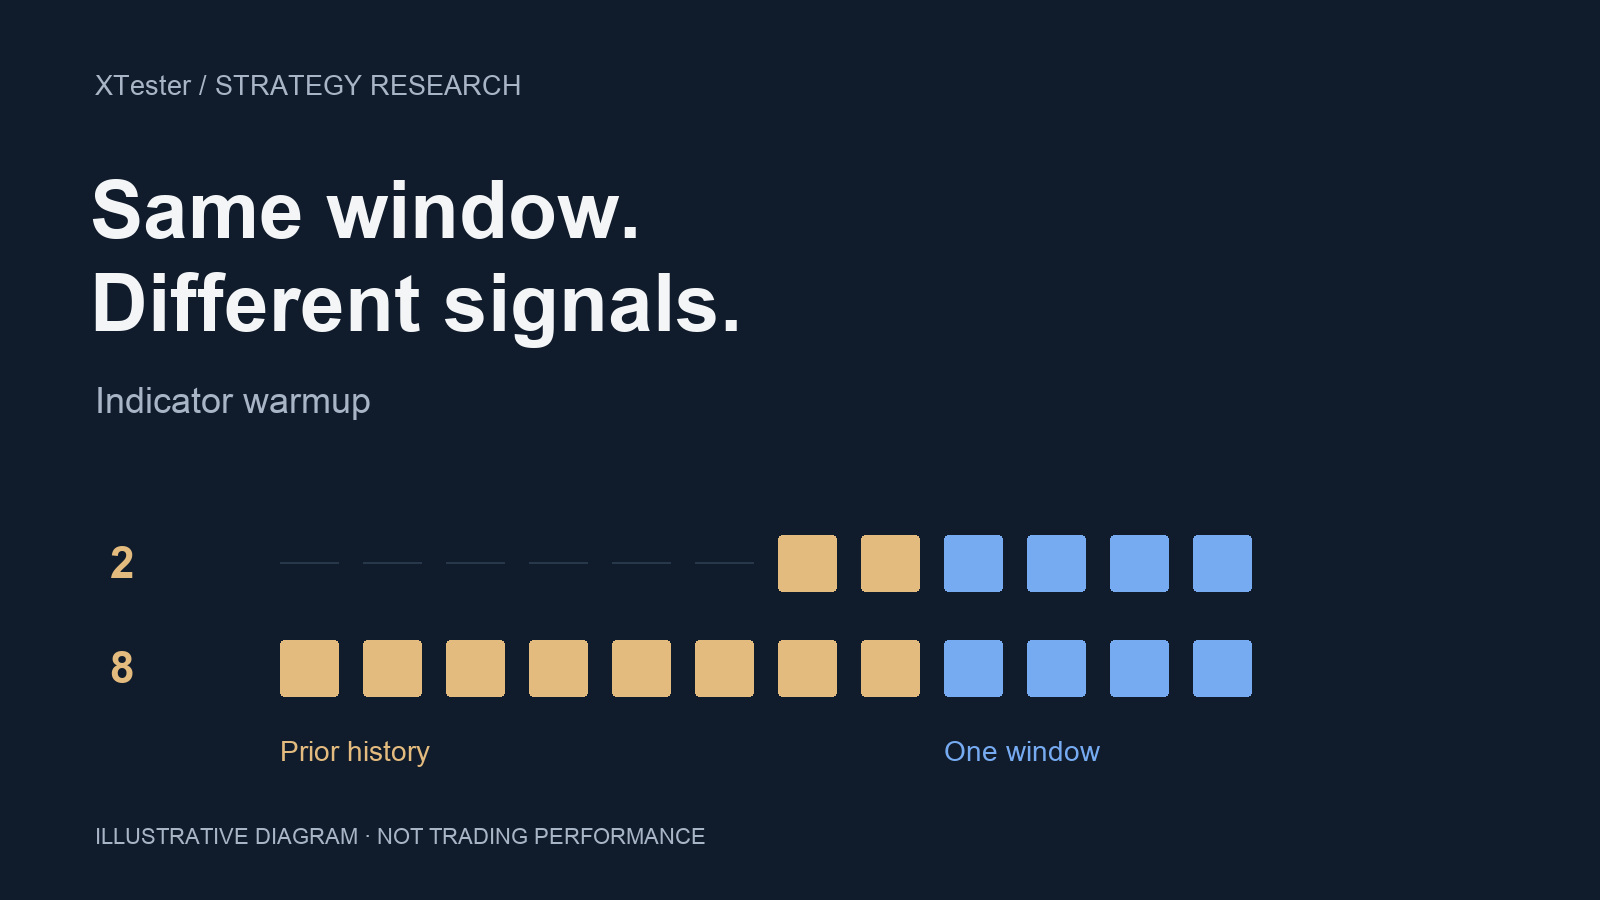
Check indicator warm-up separately. For the local comparison, use the same preceding history, sufficient for all selected periods, and the same start time for trading decisions. Otherwise parameter sensitivity can be confused with initialization effects. The article on indicator warm-up in a fixed trading window explains how to separate them.
An identical cost model makes runs comparable, but that model can still be unrealistic. Keep a higher-cost stress test separate from the parameter changes and record it as another experiment. The crypto strategy backtesting guide covers basic data and execution requirements.
For each configuration, retain the run identifier, exact parameter value, result after modeled costs, maximum drawdown, closed-trade count and time in the market. Record any position still open at the end, errors and incomplete data coverage separately. An open-position valuation is not a closed trade. When a result jumps unexpectedly, open the trade records and locate the first decision that changed.
Read parameter robustness without picking another winner
Initially, order the table by parameter value rather than profit. That makes the pattern of changes visible. Do not remove weak configurations, average errors as zero results or treat an unfinished run as a completed check.
| What you observe in nearby configurations | What it means for the next step |
|---|---|
| Results and drawdown change moderately, with comparable trading activity | No sharp local sensitivity was found on this sample. Retain the candidate and move to a separate evaluation on unused data. |
| A small adjustment sharply changes trades or drawdown | Examine the first diverging decisions, entry threshold, rounding and execution constraints. This calls for diagnosis; it does not automatically prove curve fitting. |
| Results are similar, but there are hardly any trades | There is not enough evidence to assess robustness. Similar empty statistics establish nothing. |
| Unacceptable drawdown or losses persist throughout | A smooth relationship does not make the candidate suitable. It has failed your criteria. |
| A neighboring setting is much more profitable | Do not silently replace the original. If you select it, record a new version and acknowledge that this sample is part of development. |
A “plateau” usually means a region of similar results across different settings. It may look wide simply because values were rounded to the same number or no threshold was crossed. Verify that the new parameters actually reached the calculation and could affect decisions. Identical trades are possible, but you need to understand why they are identical.
Neighboring configurations share the same history and often the same trades. They are dependent observations, not independent confirmations of a strategy. Even a convincing table cannot turn a repeatedly inspected sample into out-of-sample data. Set aside unused data before the next stage; see the article on walk-forward and out-of-sample testing for the separation rules.
Running the check in XTester
The current public simulation help, marked for XTester Studio 1.0.0-preview.1, describes the “Strategy Parameters” tab. After compilation and a list refresh, it shows parameters declared by the code. Enter an allowed value and begin a new run. “Continue” preserves the parameters of an already paused session, so changing a form field does not mean the active calculation uses it.
There is also a documented route from a completed regular background backtest: select “Check Robustness” in “Calculations.” The “Additional checks” section supports predefined parameter variants; additional checks are disabled by default. Before starting, inspect the preview, candidate identity, periods, warm-up and limitations. The statistics and robustness-check help explains availability and conditions.
That built-in workflow is broader than a local comparison over one fixed window. The help describes historical episodes that can overlap, among other checks. Do not treat its report as completion of your particular plan until you have compared the actual conditions. For a dedicated neighboring-parameter comparison, retain comparable runs and keep phase or cost checks separate. A positive assessment in a report means the selected criteria were met, not that future profitability has been established.
These product descriptions come from public documentation, not an experiment we ran in the application. Check your installed build and available actions against that documentation.
Start with one candidate and a neighborhood written down beforehand. After the calculations, record a short decision: continue evaluating the unchanged candidate, investigate sensitivity or acknowledge insufficient evidence. If you want to choose a different value, save that as a new development step. The record will then show what was tested and what remains unknown.
This is educational material, not investment advice. Local robustness does not establish a strategy's profitability or safety. Backtests do not guarantee future results; live trading can lead to loss of funds.
This material is for information only and is not investment advice. Backtest results do not guarantee future returns.