XTester
 Walk-Forward and Out-of-Sample Testing: Where a Strategy Loses Stability
It is easy to improve a strategy on the same historical sample used to judge it. Parameters, filters and exit rules can be changed until the equity curve looks convincing. At that point, however, the test no longer asks how the strategy behaves on unfamiliar data. It shows how well the research process described a known past.
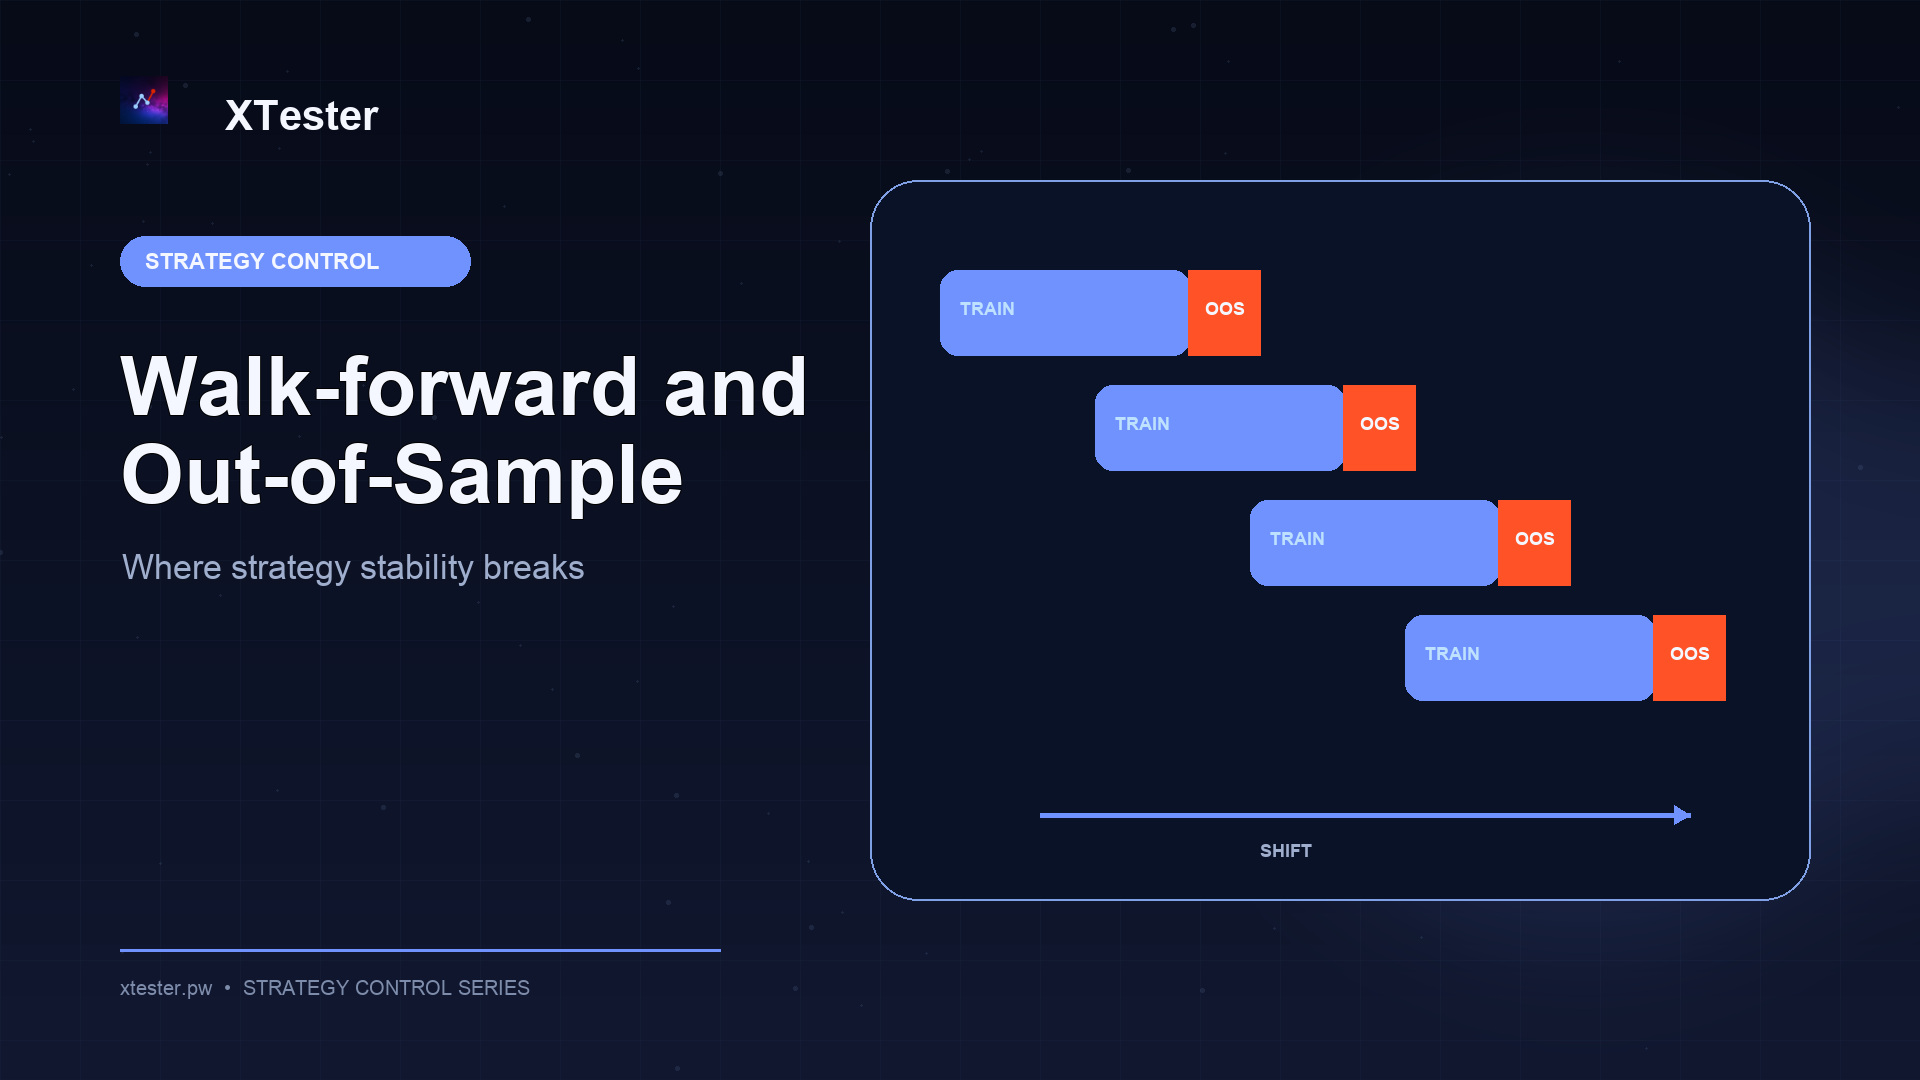
Out-of-sample testing separates parameter selection from evaluation. Walk-forward testing repeats that separation through time: parameters are selected on one window, evaluated on the next, and then both windows move forward.
The goal is not another attractive summary metric. A useful experiment reveals where, and under which conditions, the behavior stopped being stable.
Why one train/test split is not enough
A basic experiment divides history into two parts:
- an in-sample period for development and parameter selection;
- an out-of-sample period kept untouched until evaluation.
That is better than scoring a strategy on the same data used to tune it. But a single split creates one boundary and one set of market conditions. The strategy may get lucky in the selected test period, or encounter a regime it was never designed to trade.
Walk-forward testing creates several sequential evaluations. Every out-of-sample window comes after the information available to its corresponding training window. The test segments can then be joined into a separate OOS history.
This design better reflects the research constraint that each decision may use only information from the past.
Rolling and anchored windows
Two common walk-forward designs treat training history differently.
Rolling window. Training length stays fixed. As the experiment moves forward, the oldest records leave the sample. The strategy can respond faster to recent conditions, but parameter selection uses less history.
Anchored window. The training start stays fixed while the end moves forward. The available history grows. This preserves older regimes, but they continue to influence every later selection.
Neither design is universally correct. The choice depends on the hypothesis about how quickly the researched effect changes. It should be made before the OOS results are reviewed and stored as part of the experiment.
The plan should also fix:
- training and test window lengths;
- step size;
- permitted parameter ranges;
- the parameter-selection rule inside each training window;
- fees, funding and slippage assumptions;
- instruments and history available at each point in time.
Changing those rules after every weak segment gradually turns out-of-sample data into another training set.
Guarding against future leakage
Chronological windows do not automatically make a test honest. Future information can leak through data preparation, feature construction or model selection.
Review at least these boundaries:
- every indicator uses values available at decision time;
- normalization and thresholds are fitted inside the training window, not across the full history;
- the instrument universe is known at the historical date rather than reconstructed only from survivors;
- funding, fees and contract specifications belong to the tested period;
- a decision made at bar close is not filled at a price known only after that close;
- overlapping labels or positions do not carry information across a window boundary;
- the final OOS segment is not reused for another tuning pass.
For infrequent strategies, a short test window may contain too few trades to interpret. A longer window provides more observations but mixes more market regimes. The report should explain that trade-off instead of hiding it behind one score.
Reading OOS results segment by segment
Total return can conceal the location of instability. Preserve the sequence of test windows.
For each window, record:
- in-sample and out-of-sample dates;
- selected parameters;
- trade count;
- result after modeled costs;
- maximum drawdown;
- profitable and losing trade counts;
- exposure and average holding time;
- any simulated skipped or rejected orders.
Then ask questions that an aggregate curve cannot answer. Do parameters change gradually or jump between extreme values? Does the result persist across several windows or depend on one? Does it survive fees and funding? Is there enough activity to interpret the segment? Does a failure coincide with a change in volatility, liquidity or market regime?
A walk-forward test does not need to produce the same profit in every window. But a strategy that works only around one precise parameter value and collapses after a small change needs more investigation.
Signs of an unstable result
Warning signs include:
- strong in-sample performance followed by repeated weak OOS segments;
- a combined result dominated by one short window;
- selected parameters jumping sharply between windows;
- the apparent edge disappearing after realistic costs;
- too few trades in most test segments;
- experiment rules changing after OOS results are seen;
- no consistent record of data, code and settings.
No single sign proves overfitting. Each one identifies a place to stop and review the hypothesis, the data and the selection process.
A practical XTester workflow
The public XTester site includes walk-forward, out-of-sample checks and metrics in its backtesting methodology. The exact automation available depends on the installed version, so the experiment should remain understandable without relying on a particular interface control.
A disciplined sequence is:
- Write down the hypothesis and strategy rules before optimization.
- Choose the market, period, data source and cost model.
- Reserve a final segment that will not be used during development.
- Define the window design and parameter-selection rule.
- Run sequential tests without access to future segments.
- Preserve code, parameters and results for every window.
- Join only the OOS segments into a separate history.
- Review stability across windows rather than only the combined total.
- Treat a changed hypothesis as a new experiment version instead of overwriting the old one.
The broader data and cost checklist is covered in How to Backtest a Crypto Strategy Without Overestimating the Result. Walk-forward testing is a later validation layer, not a replacement for a realistic simulator.
What walk-forward testing cannot prove
Sequential OOS evaluation reduces opportunities for self-deception, but it does not remove them. The result still depends on data quality, the number of hypotheses tried, the execution model and window boundaries. If a research team tests hundreds of ideas and reports only the one that survived, selection bias remains.
A stable historical result also does not guarantee future returns. Live trading adds real fees, latency, liquidity limits, venue constraints and changes in the market itself.
The value of a good walk-forward experiment is transparency, not a profit promise. It shows when the strategy stopped matching its hypothesis and preserves enough evidence for another researcher to repeat the test.
This article is for educational purposes and is not investment advice. Every backtest models past conditions and cannot guarantee future results.
This material is for information only and is not investment advice. Backtest results do not guarantee future returns.