XTester
Indicator warmup in backtests: why the history start changes signals
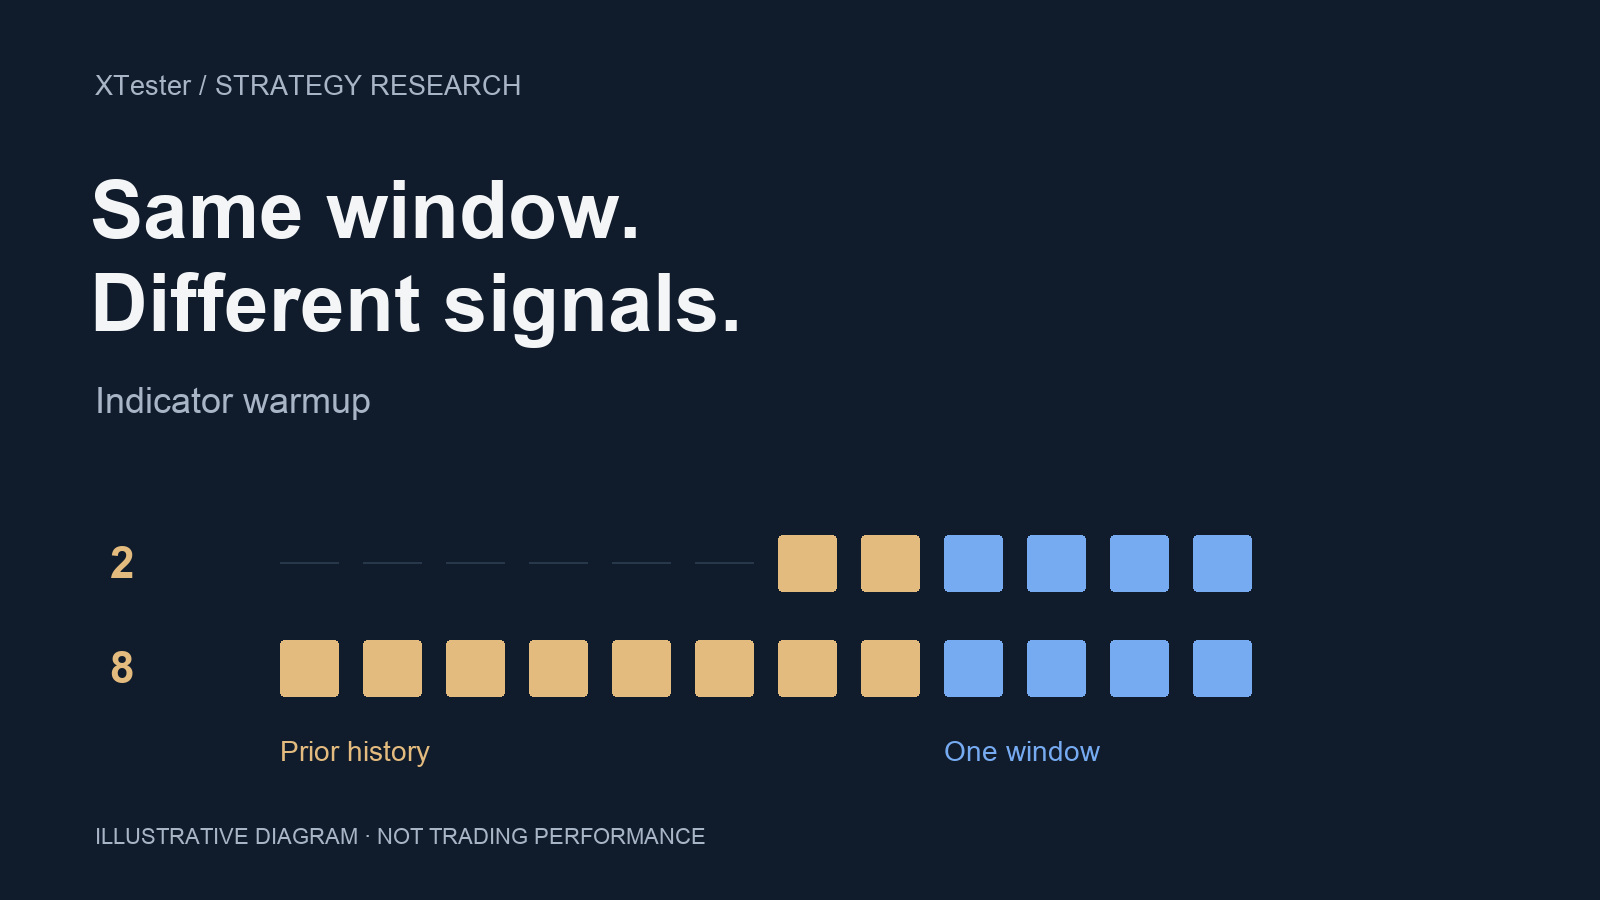
You add a few days of history without changing the strategy, and an entry moves within the original test period. Indicator warmup may explain it: the extra history changed the indicator’s initial state. Test that explanation over a fixed trading window. Simply starting trading earlier also changes the position, capital and working orders by the time you reach the disputed signal.
This article assumes continuous history with no missing candles. If your data has gaps, start with the separate guide to missing candles.
Why the EMA period is not its warmup length
Indicator warmup in a backtest means processing past data before the decisions you want to evaluate. Producing the first numeric value is not enough: it may still depend materially on where the calculation started.
An EMA combines the current price with the previous indicator value:
EMA[t] = alpha × Close[t] + (1 − alpha) × EMA[t−1], where alpha = 2 / (N + 1).
You also need to define its initial value, or seed. Our example uses the first available closing price. Another library may start with an average of several prices; the name EMA alone does not establish identical initialization.
Once two calculations receive identical prices, the difference between their EMA values is multiplied by 1 − alpha at each update. It shrinks, but a small residual can still flip a condition near its threshold. For RSI and other recursive indicators, check the particular implementation. The period in the name is not a universally sufficient warmup length.
A worked example: the same candles, a different first entry
Take synthetic hourly closing prices for 1 January 2026. Candles opening at 00:00–05:00 UTC close at 80; those opening at 06:00 and 07:00 close at 100. The four candles in the trading window open at 08:00–11:00 and close at 99, 101, 98 and 102. These are illustrative prices, not exchange data.
We calculate EMA(3), with alpha = 0.5. One run has two candles of prior history; the other has eight. The seed candle counts toward that total. Immediately before the window, the EMA values are 100 and 95. Prior history updates only the indicator: no trading decisions are allowed during warmup.
Both runs use the same window: candle opens from 08:00 inclusive to 12:00 exclusive, with decisions at their closes from 09:00 to 12:00. Both start flat, with no orders or post-trade cooldown. After updating the EMA, record an entry if Close is above it and the state is flat; record an exit if Close is below it and the state is long. Equality leaves the state unchanged.
| Close time, UTC | Close | EMA: 2 candles | EMA: 8 candles | Decision: 2 / 8 |
|---|---|---|---|---|
| 09:00 | 99 | 99.5 | 97 | wait / enter |
| 10:00 | 101 | 100.25 | 99 | enter / hold |
| 11:00 | 98 | 99.125 | 98.5 | exit / exit |
| 12:00 | 102 | 100.5625 | 100.25 | enter / enter |
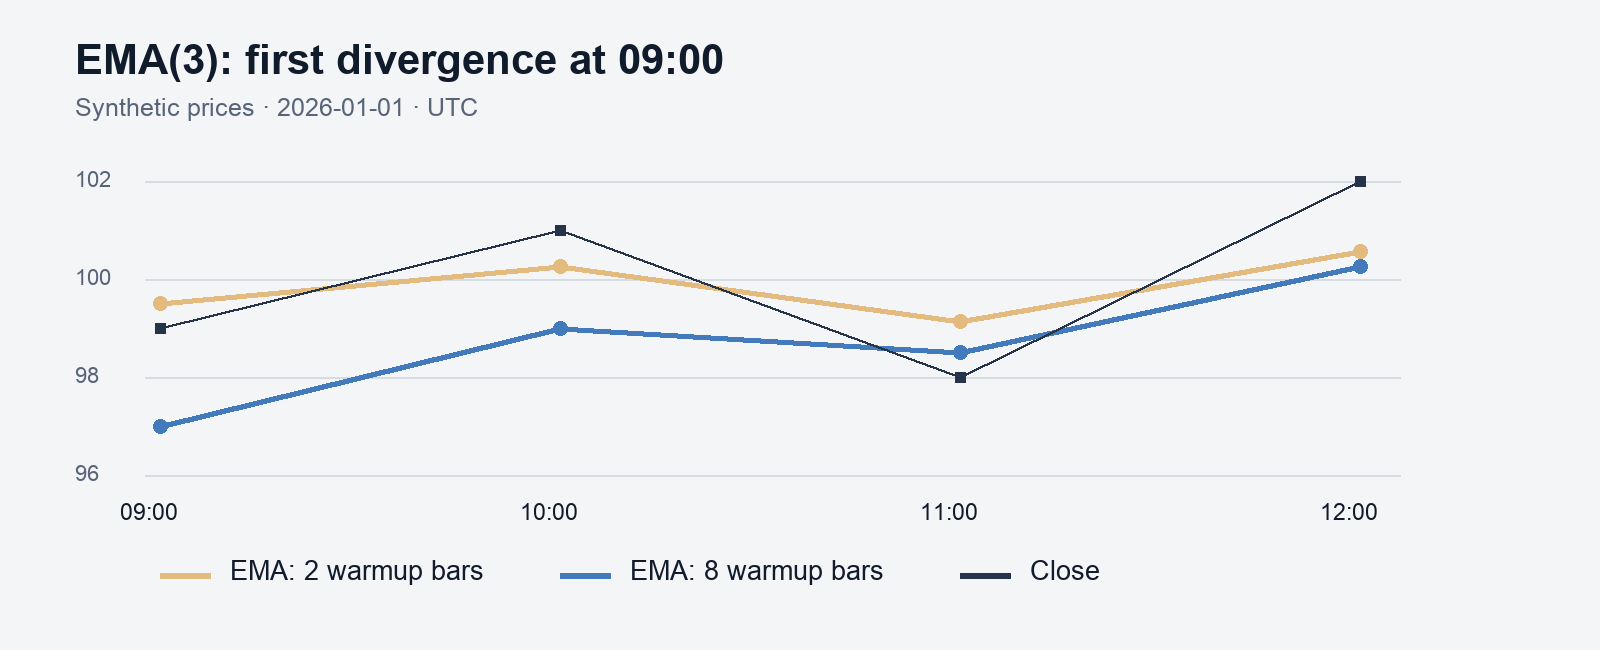
This is a Python decision calculation, not an XTester run or a trade-execution model. The long/flat state changes notionally at decision time. Fill prices, sizing, balances, fees and profit are not calculated. The complete series and code accompany the article for reproduction.
The first divergence is at 09:00: the price of 99 lies between the two EMA values. At 10:00, both calculations see Close above the EMA, but act differently because one has already recorded an entry. Two of the four actions differ. By the final point, the EMA gap has fallen from 2.5 to 0.3125, yet the earlier difference remains in the decision log.
An additional run with four warmup candles matched the eight-candle run. That follows from the constant early prices in this example. It is not a recommendation to warm up every indicator with four candles.
Test warmup without selecting for profit
Freeze the code, indicator library, seed rule, price source, instrument, timeframe and one evaluation window. Choose several warmup lengths in advance. Keep starting funds, the absence of positions and orders, counters and other trading variables identical across runs. Do not reset the indicator at the window boundary: its sensitivity is what you are testing. Do not trade during warmup.
Match rows by the same timestamp: price, indicator values, state before the decision and the decision itself. Compare both the maximum numeric difference across the window and the first different action. If you use a tolerance, specify it before inspecting results, in meaningful units. Even a small difference can cross a trading threshold.
Freqtrade’s recursive analysis addresses a related problem by comparing indicators across different amounts of prior history. Its documentation explicitly limits the comparison to the last row and does not assess the impact on entries and exits. For this diagnostic, that makes the full decision log important, not just similar final values.
Agreement in the selected window means only that this experiment found no differences. Check other windows chosen in advance. Do not select warmup by the best profit: that turns the exercise into tuning against results. The distinction between development and evaluation is covered separately in the walk-forward and out-of-sample guide.
Where to start in XTester
Check the period and starting funds against the simulation documentation. Then add a log of values and decisions to your strategy code, separating prior-history processing from the trading window. This is a diagnostic method, not a claim that XTester has a ready-made automatic warmup-check button. Check the implementation against the API of your installed version.
If you have not yet checked historical-data loading and logging, start with the first verification backtest. Then save two comparable runs and investigate the first mismatch. It will show whether the threshold condition itself changed or an earlier decision is already affecting subsequent actions.
This is educational material, not investment advice. Removing warmup sensitivity does not establish a strategy’s profitability or safety. Real trading can result in loss of funds.
This material is for information only and is not investment advice. Backtest results do not guarantee future returns.