
Porting Pine Script to XTester: How to Verify Behavior
The TradingView equity curve is green. The Pine Script source has been converted, the new C# project compiles, and the first XTester run completes. Then the trade list tells a different story: entries are one bar late, some stops fill at different prices, and position size drifts after a few signals.
That is the central problem in strategy porting. A syntactically correct translation can still produce a different trading system.
The signal formula is only one part of a strategy. Its behavior also depends on a clock, an order lifecycle, position state, sizing rules, costs, a data source, and a policy for the open bar. Unless those rules are made explicit, “conversion” is too vague to be useful.
XTester 0.0.88 introduced Strategy Transfer, a workflow that imports third-party strategy source into a separate XTester project. It builds a behavior model, surfaces incompatibilities, generates C#, compiles the result, and produces a conversion report. That pipeline does not prove that two backtests must match. The final step is still research work: run the port on comparable data, compare trades, and explain every material difference.
This guide walks through that process with a Pine Script example from TradingView. The example is educational. It is not a trading recommendation or a ready-made profitable strategy.
You are porting an execution contract
Consider a simple idea:
Go long when a fast EMA crosses above a slow EMA, but only when the four-hour trend is up. Size each entry at 10% of the available equity when the trade opens, allow at most two same-direction entries in the position, use a 3% stop, and take profit at 6%.
That description is not enough to reproduce the trades.
You still need answers to questions such as:
- Does the script evaluate only when a bar closes, or on every price update?
- Does a market order fill on the signal update, on the next tick, or at the next bar’s open?
- Does the four-hour filter use the last confirmed higher-timeframe bar or the developing one?
- Does “10% of equity” describe order size or loss at the stop, and which balance is the base?
- Does pyramiding allow two total entries or two additions after the first?
- Does another signal add to the position, do nothing, or reverse it?
- Are the stop and target anchored to the first entry or recalculated from the average position price?
- Which commission, slippage, funding, session, and timezone settings produced the reference report?
Together, those answers form the strategy’s execution contract. Pine Script and C# are two possible implementations of that contract.
This distinction matters outside migration work as well. If a trader cannot describe the execution contract, they cannot reliably explain either the backtest or a difference between simulated and live behavior.
A short script can carry a long list of assumptions
Here is a deliberately simple Pine Script example:
//@version=6
strategy(
    "HTF Trend Port Example",
    overlay = true,
    initial_capital = 10000,
    default_qty_type = strategy.percent_of_equity,
    default_qty_value = 10,
    pyramiding = 2,
    commission_type = strategy.commission.percent,
    commission_value = 0.08,
    slippage = 2
)

fast = ta.ema(close, 20)
slow = ta.ema(close, 50)

if timeframe.in_seconds() >= timeframe.in_seconds("240")
    runtime.error("The chart timeframe must be lower than 240 minutes.")

htfClose = request.security(
    syminfo.tickerid, "240", close[1],
    lookahead = barmerge.lookahead_on
)
htfEma = request.security(
    syminfo.tickerid, "240", ta.ema(close, 50)[1],
    lookahead = barmerge.lookahead_on
)

longSignal = ta.crossover(fast, slow) and htfClose > htfEma

if longSignal
    strategy.entry("L", strategy.long)

strategy.exit(
    "LX", "L",
    stop = strategy.position_avg_price * 0.97,
    limit = strategy.position_avg_price * 1.06
)
The script is about 40 lines, but the porting job is not limited to ta.ema(), strategy.entry(), and strategy.exit().
The strategy declaration carries initial capital, the default sizing method, pyramiding, commission, and slippage. The request.security() calls encode a policy for confirmed higher-timeframe data. The protective orders use strategy.position_avg_price, so their levels can move after another entry changes the average price. The script also leaves TradingView’s standard calculation and broker-emulator settings in effect unless the user changes them elsewhere.
Copying only the EMA crossover creates a new strategy with a similar signal. The rest of the execution contract is gone.
Seven places where trades diverge
1. Signal time and fill time are different events
Under TradingView’s default strategy behavior, an order is created after a calculation and the broker emulator cannot fill it before the next available tick. When the strategy calculates only at bar close, that next tick is usually the following bar’s open.
“Enter on the EMA crossover” is therefore incomplete. The condition may become true at a bar’s close while the report records the trade at the next open.
If a port buys at the signal bar’s closing price, its entries are systematically earlier. The difference may look harmless in quiet data. A gap, a fast market, or a short timeframe can change the entry price, position size, and every protective order that follows.
The example has another timing dependency. strategy.exit() derives its levels from strategy.position_avg_price, but calc_on_order_fills is not enabled. With the standard settings, the entry can fill at the next bar’s open while the next calculation with an available average position price does not happen until that bar closes. Only then can the script create the stop and limit from that price. If “On order fill” is enabled in Strategy Properties, Pine can recalculate immediately after the fill and place the protection sooner. That setting must travel with the source code.
On historical bars, enabling calc_on_order_fills can also introduce lookahead bias because a calculation after a fill can access the bar’s final OHLC values. Preserve the setting when reproducing a reference, but do not enable it merely to make protection appear faster.
When a trade is off by one bar, start with a precise question:
Are we comparing the update that created the order or the update that filled it?
2. Historical bars and the open realtime bar do not behave the same way
Pine runs sequentially across historical bars. On the open realtime bar, a script can recalculate as new updates arrive. Before a recalculation, rollback restores temporary values to the last confirmed state unless the code uses a mechanism designed to persist data within the bar.
A condition can appear during the bar and disappear before the close. After the script reloads, that transient signal may not exist in history in the form a trader saw live.
TradingView uses “repainting” for the broader class of behavior where historical and realtime calculations or plots differ. Repainting is not automatically fraudulent or useless. For trade orders, however, the difference must be understood and documented.
A porting specification should state:
- bar-close or intrabar calculation;
- whether intermediate ticks are required;
- which state survives updates;
- whether a signal can disappear before the bar closes;
- whether the target environment has comparable data granularity.
If the source depends on the actual sequence of intrabar ticks and the target has only OHLC bars, literal parity may not be possible. The result should document that limitation and the chosen adaptation.
3. A stop-limit order is not another kind of stop
Market, limit, stop, and stop-limit orders describe different event sequences.
Stop-limit semantics are especially easy to lose. Price must first reach the stop level. That activates a separate limit order, which may fill at the limit price or better, or may never fill. Replacing it with a stop-market order changes fill probability and price. Replacing it with a plain limit order changes when the order starts to exist.
The same problem appears with trailing orders, OCO and bracket structures, amendments, and fill callbacks. If the target API has no direct equivalent, the port needs a recorded decision:
- express the behavior with another supported construct;
- accept a specific approximation;
- move part of the behavior into the environment or launch profile;
- omit the block;
- stop the conversion.
A visible refusal is safer than a quiet substitution that compiles and trades differently.
4. Pyramiding changes position state
The example uses pyramiding = 2, which permits at most two same-direction entries in one position: the initial entry and one addition. That number alone does not describe the full behavior. The port must preserve how repeated entries are counted, how the platform treats an order ID, how average price changes, and what happens when an opposite signal arrives.
The tutorial’s ta.crossover() condition fires once at the crossing, so this code does not by itself demonstrate an addition while the position remains open. If a production strategy does submit another entry, strategy.position_avg_price changes on the next strategy calculation after that fill. The stop and target then move as well. A port that anchors them to the first fill may diverge only at the exit.
Compare the closed-trade list together with state after each event:
- first entry: time, side, fill price, and quantity;
- additional entry: whether it was allowed and how size and average price changed;
- partial exit: remaining position, fees, and active protective orders;
- final exit: reason, price, and total size;
- opposite signal: ignore, close, or reverse.
5. “10%” can refer to different money
Pine strategies can use default sizing properties or an explicit qty on an order. This example uses strategy.percent_of_equity: each order is sized at 10% of the available equity when the trade opens. That is position size, not a promise to risk 10% of equity. With a 3% stop, the planned loss before costs is only a fraction of the position notional; gaps and slippage can increase it.
Each later entry is sized again from the available equity when that trade opens. A port that uses a fixed quantity may match the first few trades and then drift. That drift affects P&L, equity, later order sizes, average price, and protective levels. True risk-based sizing requires a separate qty calculation from the allowed monetary loss, stop distance, point value, and instrument rounding rules.
The porting record should specify:
- units: contracts, base asset, cash, or a percentage;
- sizing base: initial capital, cash, available balance, or current equity;
- rounding and quantity step;
- instrument or venue limits;
- behavior when funds are insufficient;
- leverage and margin mode where relevant.
Matching the percentage is meaningless if the two platforms apply it to different balances.
6. Higher-timeframe data can leak the future
request.security() can retrieve another symbol or timeframe. Its lookahead setting controls whether requested values on historical bars may include information from a later point in time.
The example uses a common confirmed-data pattern: barmerge.lookahead_on with a one-bar offset in the expression. It is valid only when "240" is genuinely higher than the chart timeframe, so the example includes an explicit guard. The intent is to use the previous, confirmed higher-timeframe value. A port must preserve that intent. Removing the offset or replacing the expression with the “latest” four-hour close can make the filter see a completed HTF bar too early.
For each multi-timeframe block, answer three questions:
- What value was available on a historical chart bar?
- What value was visible while the realtime bar was still developing?
- When did the higher-timeframe update become available to the lower timeframe?
This mistake often makes a port look better rather than obviously broken. The code has started using information before the source strategy could have known it.
7. The same logic on different data is still a different test
Even when the trading logic matches, results depend on the data and fill model.
Compare more than the symbol and timeframe:
- exact venue or data source;
- spot versus futures;
- trading sessions and timezone;
- history range and warm-up;
- gaps and bar construction;
- commission, slippage, and funding;
- price and quantity precision;
- intrabar data and assumptions;
- margin and liquidation rules where relevant.
TradingView can use Bar Magnifier to refine historical intrabar fill assumptions. Another engine may have a different set or sequence of lower-timeframe bars or ticks. That is not automatically a defect in either engine. It is a difference in inputs and simulation rules that must be disclosed.
Build a behavior passport before conversion
Before starting the conversion, create a short record of the source strategy:
- source version: file, commit SHA, or immutable archive;
- platform: Pine version and relevant Strategy Properties;
- data: venue, market, symbol, timeframe, and HTF/LTF requests;
- session: timezone, trading hours, and excluded periods;
- signals: entry and exit conditions, bar close or intrabar;
- orders: market, limit, stop, stop-limit, lifetime, cancel, and replace;
- position: long/short, pyramiding, netting/hedging, and reversal;
- sizing: unit, capital base, rounding, and limits;
- costs: commission, slippage, funding, and borrow cost;
- state: cross-bar variables, warm-up, and external dependencies;
- reference: a closed-trade export over a fixed range.
This record narrows the search space. When trade 20 differs, you can inspect a specific rule instead of comparing two equity curves and guessing.
What XTester does before the trade comparison
Strategy Transfer treats the source as data and does not execute it. XTester identifies trading rules, state, sizing, order types, and dependencies; asks the user to resolve incompatibilities; creates a separate C# project; compiles it; and checks the result against the behavior model. The supported inputs and stages are covered in the XTester 0.0.88 Strategy Transfer overview.
That pipeline prepares the port for inspection. Compilation and semantic audit do not establish trade correspondence, so the next step is a comparison with the TradingView reference export.
Compare the port with a reference trade list
Run the converted project in the XTester Simulator over a comparable range. You can then use “Check against reference…” with a TradingView Strategy Tester List of trades export or a generic CSV:
time,side,price,qty,action
2026-01-12T08:00:00Z,long,42150.5,0.023,entry
2026-01-13T16:00:00Z,long,44679.0,0.023,exit
XTester greedily matches entries one to one in chronological order within a ±N-bar tolerance, configurable from 0 to 5 bars and defaulting to 1. It then reports entry matches by time and direction, direction among time-matched entries, and exits among matched entries.
Entry-match labels are:
≥95%: high entry correspondence;≥80%: predominant correspondence;≥60%: partial correspondence;- below that: divergent from the reference.
These labels support diagnosis and do not certify equality. Even 100% entry correspondence within the selected tolerance — ±1 bar by default, configurable from 0 to 5 — does not prove equal prices, sizes, exits, fees, or P&L.
Start with the first mismatch
A useful order of work is:
- find the first unmatched trade;
- compare the data that produced the signal;
- check order creation and fill timing;
- reconstruct position state before the event;
- compare sizing and rounding;
- inspect active stop and limit orders;
- move to the next difference only after the first one is explained.
Later differences are often downstream effects. One missing entry changes equity, the next order size, average price, protection levels, and the rest of the trade sequence.
Keep a small discrepancy log:
- Timestamps differ by one bar. First verify that both timestamps represent order fills. A TradingView
List of tradesrow records an executed trade, not the signal condition. If both are fill timestamps, fix the port’s order timing; use a one-bar tolerance only to locate comparison candidates. If one dataset records signal creation, normalize event semantics before comparing. - The second entry is missing. Cause: the port uses
pyramiding = 1. Decision: fix the position contract. - The stop fills at another price. Cause: the intrabar data differs. Decision: record the fill-model difference.
- Quantity drifts after trade 5. Cause: fixed size replaced percent of equity. Decision: fix the sizing base.
“Backtests differ” has now become a list of testable causes.
When is the port ready for use?
A C# file and one successful build do not close the porting job.
A practical acceptance gate can include:
- the source is pinned to an exact version;
- all required files and dependencies were read;
- the execution contract is complete;
- no material incompatibility remains unresolved;
- the project compiles and passes sandbox checks;
- the semantic audit found no missing required branch;
- both tests use comparable data and settings;
- the first set of discrepancies has an explanation;
- sizing, costs, and protective orders were checked separately;
- the report records every accepted adaptation;
- the trader knows what is still unverified.
A bar-close crossover may reach high trade correspondence. A strategy that depends on ticks, closed libraries, unsupported order behavior, or a broker-specific margin model may not. A limited result is not a process failure. Hiding the limitation and calling the port identical would be.
What Strategy Transfer does not prove
The converter does not prove that:
- two platforms will report equal results;
- generated code is profitable;
- historical behavior will survive live execution;
- a missing closed-source dependency was reconstructed exactly;
- intrabar logic can be reproduced without comparable ticks;
- a high entry-match score implies the same risk.
Its job is to make the migration inspectable. The pinned source, behavior model, user decisions, generated project, report, and trade-level comparison create an evidence trail that can be reviewed step by step.
A one-click converter may save a few minutes. An explicit execution contract can prevent weeks of optimizing the wrong strategy.
A practical workflow
If you have a Pine Script strategy from TradingView:
- Pin the source and export
List of tradesfor a fixed test range. - Save Strategy Properties: capital, sizing, pyramiding, commission, slippage, and calculation settings.
- List every multi-timeframe, intrabar, and repainting dependency.
- Open the XTester Project Wizard and choose third-party strategy conversion.
- Review the behavior model; do not accept incompatibilities automatically.
- Create a separate target environment with the same market, symbol, timeframe, and costs.
- Compile the port and read the final conversion report.
- Run the Simulator and compare closed trades with the reference.
- Explain the first mismatch before chasing later ones.
- Keep every accepted difference with the strategy documentation.
The result is a C# project with recorded settings, accepted differences, and a documented boundary of confidence.
If you are preparing a port now, start with the Strategy Transfer overview, then pin a reference List of trades before conversion.
Sources
- XTester 0.0.88: Strategy Transfer into XTester
- TradingView Pine Script: Strategies
- TradingView Pine Script: Execution model
- TradingView Pine Script: Other timeframes and data
- TradingView Pine Script: Repainting
This material is for information only and is not investment advice. The example exists solely to explain the porting process. Backtest results do not guarantee future returns.
This material is for information only and is not investment advice. Backtest results do not guarantee future returns.
Related posts
 Development
XTester Studio built on Code - OSS and XTester Engine
XTester Studio will combine the Code - OSS development environment with the existing C#/.NET XTester Engine. The editor, workspace, Git and terminal will come from Code - OSS. Data handling, simulation, execution and statistics will be carried over from the current version of XTester. We are targeting October 1, 2026 for the first public milestone.
 Development
XTester 0.0.88: porting strategies from other platforms to XTester
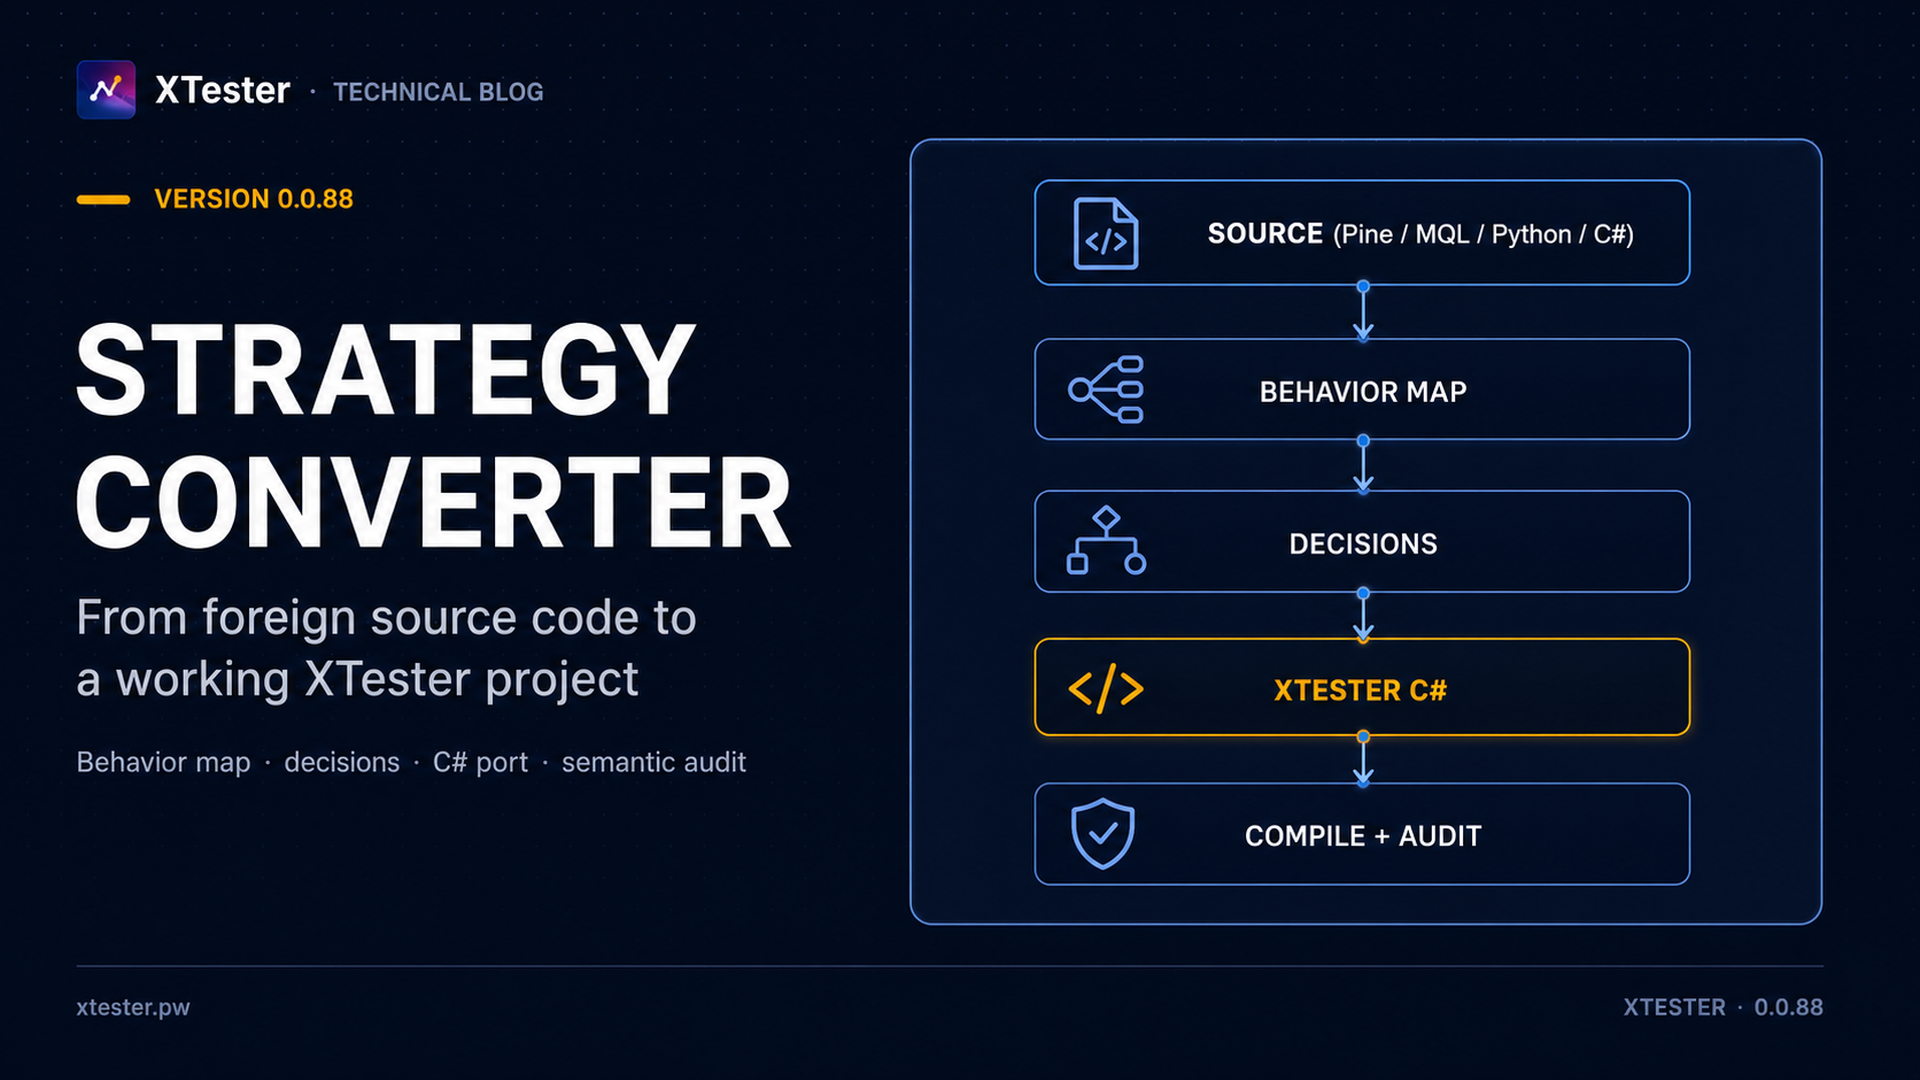
XTester 0.0.88 can read an external strategy, create a separate C# project, and report what changed during the port.
 Development
Trading strategy portfolios in XTester: shared capital, risk and the new Studio
Why strategies need to be tested on a shared balance. A look at risk allocation, a programmable orchestrator and the development of XTester Studio.